Tuesday, March 12, 2013

Measurement: Perimeter and Area

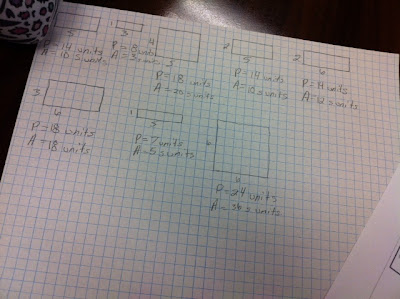
Teaching perimeter and area is one of my favorites because it can be so hands on (oh but just you wait until volume, surface area, and circumference!) Because our 4th grade teachers did such an excellent job in this area (pun completely intended!) I didn't feel the need to dwell on perimeter and area of rectangles for long.  Thanks to Pinterest, I found an easy, hands-on way to review area and perimeter of rectangles that wasn't just a worksheet to complete.  After watching a couple StudyJams videos, we went straight to work with some grid paper, two dice, and our pencils.  Students were to roll the dice and create an array to display the numbers on the dice.  Then, they were to find the area and perimeter of the array.  We discussed either counting the squares, or using the formula they used in 4th grade for area.  I worked with a couple struggling students.  I had them highlight the outside of the array in one color to find perimeter, then color the inside of the array with another color to find the area.  This really seemed to jog their memory!  Below is a picture of Aaliyah's arrays (although, I'll have to remind her that area is measured in square units....or squAREA!)


The next day, we moved on to finding the area of parallelograms and triangles.  This proved to be much more difficult, they concluded.  The triangles and parallelograms were drawn on centimeter grid paper, and at first, some students were trying to shade whole squares, then put together pieces to create more wholes.  When we shared answers and found that we all had something slightly different, we need we needed a better solution.  I asked them why finding the area of a rectangle was so easy for them, but these polygons were so much more difficult.  The conversation went something like this:

Student 1: Because with rectangles you just count the squares and that's the area!
Me: Ok.....so why are triangles and parallelograms so much harder?
Student 2: There are sometimes all these little pieces of squares that you have to put together.  Sometimes they are easy, like if it's just a half of a square.  But other times they are harder.
Me: What is it about rectangles that make it have just whole squares or half squares then? <silence in the room>
Student 3: It....has....right angles?
Me: And....?
Student 3: Right angles are squared off....so they are easier to count!
Me: So what if we made our parallelograms into rectangles so that they are easier to count?

We went on to change each polygon into rectangles and go from there.  I let them struggle with this method for homework: not all of the polygons were easy to change accurately.  On day 3, we went at it again.  Many students came in frustrated and unsure if their answers were correct.  And this is how we led into the discovery of the formula for finding the area of triangles and parallelograms!

We began class by looking at a scalene triangle and trying to find its area.  I had them do what they did before.....divide it into 2 rectangles and find the area of each, then add them together.  This time, however, they had to add up a bunch of half squares and quarter squares.  It took them forever and they were frustrated (yet again).  After all that, they knew they still had to divide it in half because it was only a triangle.  That's when they saw that they were really just finding the area of a rectangle and dividing it in half!  We tried this method, which was much simpler to multiply the length by the width, then divide in half, rather then count up all these pieces of squares.  I actually had one student's face light up as she yelled out "OhMyGosh! That is SO much easier!  Can we ALWAYS do it like that?!" To which I happily replied, "Yes, Ivy, because you just figured out the formula for finding the area of a triangle!"  They were so relieved, and shocked, that it was THAT easy.  We did a similar discovery lesson with parallelograms, cutting them in half and making them rectangles.

The last 15 minutes of class were spent updating our notebooks and reflecting.  We used the right side so show sample problems and made sure to highlight the base and height of each polygon in separate colors to help out our brains.  Then, on the left side, I allowed them to write whatever they wanted on area of parallelograms and triangles.  They were told they could use words, pictures, examples, formulas, or a combination to reflect on what they had learned.  I think they did a great job! They even asked for more time! Here are some examples on the work we've done in our notebooks for area and perimeter:

Each student received two random arrays.  They were asked to find the perimeter of one, use it to define perimeter, and think of examples.  Then, we did the same with area of the other.  Great visual! 


Here is the right side of Allison's notebook.  They used one color highlighter for base, and one for height to help them see that they come together to form a right angle.

Here are a couple of the left side thinking from my students.  Again, they were able to write their own notes on area.  Each are a little different, but reflect how each student prefers to receive their information.


And lastly, as usual, we always make an anchor chart after we have learned something.  Perhaps, if they glance at it enough, the information will stick!!

Area of Triangles and Parallelograms Anchor Chart


Monday, March 4, 2013

Fun with P.E.M.D.A.S!

Teaching the order of operations is fun because the kids really put together all they have learned about multiplying, dividing, and exponents into some really difficult looking math!  They really feel smart and successful!  I took to the Internet to find some really creative ways to teach order of operations and to get my students something to look forward to.  After first reviewing the use of parenthesis in expressions, I taught them all about my dear Aunt Sally.  We also took advice from Runde's Room and created hopscotch squares as a kinesthetic way of learning.  Unfortunately, we couldn't go outside, so we improvised and used painter's tape in our own classroom.  (They even practice at indoor recess!)  Check out our video!


After this, they really got into it.  They even came up with their own mnemonic devices for P.E.M.D.A.S.  Some of them were hilarious!  My personal favorite was: Please Excuse My Dad's Awful Smell!

Please Excuse My Dear (Students') Awful Spelling! ;)


And of course, we just had to update our Interactive Math Notebooks.  These are really turning into something special.  We added a foldable that showed what P.E.M.D.A.S. means and the symbols we can look for for each.  We also used the left side to duplicate our hopscotch squares (we can do finger hopscotch!) and to add our own thoughts about order of operations.  Some students chose to write a letter to their future selves explaining it, while others chose to write out the steps in their own words, and still others chose to show examples.  I'm really trying to embrace the left side thinking into my notebooks more.  Here's to another try!


Check out the I <3 Math add in next to her foldable!  YAY!


Choosing the Appropriate Graph

As mentioned in my last post, we wrapped up our Data Analysis and Graphing unit with a project to show off what the students learned.  I put the students into groups of four for this project.  Also, as a change up from previous projects we have done together, I put my "high" kids all together in one group and gave them a more open project where they made more independent decisions.  Then, I mixed up the rest of the kids into groups.  This forced some of my other students to really step up and be leaders! They learned they don't always have to rely on the "smarties" of the group!  We will have to try that more often!

Each problem provided the students with a situation and data.  It was their job to figure out the most appropriate way to display the data in a graph, explain why they chose the graph they did, create the graph including a title and labels, and create analysis questions to go along with the graph.  Here are some pictures of the final products!  I think they did a great job :)

Here is a link to the PDF file of the project: https://docs.google.com/file/d/0B3J8ikuadOFIQ290OUgwMDdCalE/edit?usp=sharing


I happened to overhear my students talking about their data when one asked, "What is oldies? Like, music from the 90s?"  Sigh.....