Monday, March 4, 2013

Fun with P.E.M.D.A.S!

Teaching the order of operations is fun because the kids really put together all they have learned about multiplying, dividing, and exponents into some really difficult looking math!  They really feel smart and successful!  I took to the Internet to find some really creative ways to teach order of operations and to get my students something to look forward to.  After first reviewing the use of parenthesis in expressions, I taught them all about my dear Aunt Sally.  We also took advice from Runde's Room and created hopscotch squares as a kinesthetic way of learning.  Unfortunately, we couldn't go outside, so we improvised and used painter's tape in our own classroom.  (They even practice at indoor recess!)  Check out our video!


After this, they really got into it.  They even came up with their own mnemonic devices for P.E.M.D.A.S.  Some of them were hilarious!  My personal favorite was: Please Excuse My Dad's Awful Smell!

Please Excuse My Dear (Students') Awful Spelling! ;)


And of course, we just had to update our Interactive Math Notebooks.  These are really turning into something special.  We added a foldable that showed what P.E.M.D.A.S. means and the symbols we can look for for each.  We also used the left side to duplicate our hopscotch squares (we can do finger hopscotch!) and to add our own thoughts about order of operations.  Some students chose to write a letter to their future selves explaining it, while others chose to write out the steps in their own words, and still others chose to show examples.  I'm really trying to embrace the left side thinking into my notebooks more.  Here's to another try!


Check out the I <3 Math add in next to her foldable!  YAY!


Choosing the Appropriate Graph

As mentioned in my last post, we wrapped up our Data Analysis and Graphing unit with a project to show off what the students learned.  I put the students into groups of four for this project.  Also, as a change up from previous projects we have done together, I put my "high" kids all together in one group and gave them a more open project where they made more independent decisions.  Then, I mixed up the rest of the kids into groups.  This forced some of my other students to really step up and be leaders! They learned they don't always have to rely on the "smarties" of the group!  We will have to try that more often!

Each problem provided the students with a situation and data.  It was their job to figure out the most appropriate way to display the data in a graph, explain why they chose the graph they did, create the graph including a title and labels, and create analysis questions to go along with the graph.  Here are some pictures of the final products!  I think they did a great job :)

Here is a link to the PDF file of the project: https://docs.google.com/file/d/0B3J8ikuadOFIQ290OUgwMDdCalE/edit?usp=sharing


I happened to overhear my students talking about their data when one asked, "What is oldies? Like, music from the 90s?"  Sigh.....


Sunday, February 24, 2013

Interactive Notebooks: Data Analysis

It was nice to follow our unit on fractions with a unit on data analysis and graphing.  It gave ALL of our brains a nice little break!  Our 4th grade teachers really did an excellent job of teaching our kids all about bar graphs, line graphs, and data landmarks.  In Ohio in 5th grade, we move toward more complicated graphs such as double line graphs, double bar graphs, and circle graphs, as well as being able to look at a set of data and decide which graph would best show that data.  Going into this unit, I knew I didn't want to just show my students a bunch of graphs and have them analyze them.  I wanted to get them really involved and care about their data, which meant that we had a LOT of data to collect!  We began with a survey:


Each student got to pick their survey question and had to survey 20 people

Next, we created a frequency chart to organize the data we collected.  Because we just finished our unit on fractions, we were able to change our totals into fractions, then percents.  This allowed us to display our data in a bar graph as well as a circle graph.  To create the circle graph, we colored a strip of centimeter grid paper in the same fashion we colored our bar graph.  For example: in the picture below, Allison colored 12 squares purple because 12 people voted for math as their favorite subject (YAY!!!!), 6 squares pink for science, and so on.  We cut the strip out and taped the ends together to create a circle, and made our circle graph based on the outer edge of the circle.  That way, the regions in the circle graph were accurate.  It also gave us a great visual for how to create a circle graph.   The result is below:


 Next, we moved into double line graphs.  I had assigned one student to be in charge of taking the morning temperature and afternoon temperature everyday for a week.  Then, we organized our data into a chart. Next, I asked my students what they could tell from the data.  It was difficult for them to come to any definitive conclusions because it was difficult to visualize how the temperature changed from morning to afternoon and day to day.  So, of course, we plotted our data onto a line graph.  Once all the data was in a line graph,  the students were really able to see what happened to our temperature from day to day.  Some conclusions they made were:
"It is more likely to be warmer in the afternoon than the morning."
"The sun doesn't have time to warm up the earth at 8 a.m. in February, but by 3 p.m. it had a chance to warm everything up."
"Ohio weather is really unpredictable, Ms. McHugh!"

Welcome to Ohio, kids!  Allison's notebook is below:


 Next, we collected data on 4th graders who wrote with their left/right hand and 5th graders who wrote with their left/right hand so that we could create a double bar graph.  I left them in charge of coming up with a title, labels  and a scale.  They also dictated how they wanted their chart to look.  Each class had a slightly different title and slightly different charts, but their bar graphs were spot on!  We also decided that while a scale of 10 wasn't optimal, it was our best choice for the size of the grid paper.  The students concluded that the data would probably be pretty similar if we asked the 2nd and 3rd graders too, since the 4th and 5th were so similar.  Poor lefties! 


 We created foldables to show the definitions of our data landmarks.  I let them use a glossary but asked them to use their own words that would make sense to them and create an example.  They really know these well!  (Thanks 4th grade teachers!!!!!)   We will wrap up our unit on graphing with a project this week.  Thanks to Friday's snow day, we had to push it back.  Stay tuned!


Fun With Fractions

Fractions! It's always that time of year that requires the most focus and stamina out of my students.  I really get to see their true colors and get to see just how far I can push them.  We started with a pretty basic understanding of what fractions really are.  We busted out the fraction squares and explored how they worked and what they showed us.  This really helped, not only for my lower kids, but for my higher kids too.  My high kids love to be able to show me they know the numbers, but I also like to see that they really understand what's happening, and what better way than through the use of models?

Allison was kind enough to let me borrow her notebook.  These fraction bars gave us a great visual to start our unit on fractions!

 We really utilized our interactive math notebooks during our fraction unit.  Because this is my first year with notebooks, I haven't done a stellar job implementing the traditional left page/right page setup of notebooks.  That's something I plan to tweak for next year.  You'll notice that in the pics :) Anyway, back to fractions.  We began by using our fraction squares to find equivalent fractions.  In fact, we used fraction squares for just about everything before moving into the numbers of the problems.  Once we had the models down, we talked about what was actually happening with the fractions.  The visuals really helped when making that transition!  Below are some of the pages we entered into our notebooks on simplifying fractions and finding equivalent fractions.  
Step 3 is KEY!  If they can't prove their work with a model, then they don't really 'get it'!  We also learned how to use prime factorization as a way to find the GCF.


I did ask this student to go back and change what she was dividing by to look like a fraction rather than a whole number. !


This is one of my favorite foldables.  It took us a while but it was worth it!
 The fraction squares were perfect for teaching how to add and subtract fractions with unlike denominators.  It really was an 'ah-ha' moment for them when they saw that they could use other fraction pieces and replace them so that the result were squares of all the same size and color.  

Here is our foldable on adding and subtracting fractions with like and unlike denominators.  


Here are some of the other things we did with fractions.  Phew....it was a long unit!

This page was totally independent.  Up until this point, I had written up notes for them.  Starting now, they are coming up with their own notes and steps!  I think they did a pretty good job on their first try!

Here is a sample problem adapted from a former OAA test question.  I wanted to see if they knew to change the fractions to percents and the percents to fractions.  Most got it!


Fractions -->Decimals --> Percents foldable


Monday, December 17, 2012

Digging into the Common Core: Deep Division!

We are just wrapping up our unit on division, and I wanted to know if they really understood what it is, so I decided to have them create their own problems.  In order to get their best work, I told them we would be compiling our problems into a book to be given to our principal for Christmas.  K-5 Math Teaching Resources  is a fantastic site for problems and activities aligned to the Common Core Standards.  I found a problem aligned with 5.NBT6: Find whole-number quotients of whole numbers with up to four-digit dividends and two-digit divisors, using strategies based on place value, the properties of operations, and/or the relationship between multiplication and division. Illustrate and explain the calculation by using equations, rectangular arrays, and/or area models.  The students were asked to:

1. Create a word problem that could be solved by dividing a three digit dividend by a two digit divisor.

2. Estimate the answer to your problem.  Explain your strategy.

3. Solve your problem.  Show all your work.

4. Use a different method of solving your problem to check that your answer is accurate.  Explain your strategy.  

I was really looking to see if they knew the difference between the operations.  We have discussed clue words here and there but not in depth.  Most students were on the right track; only a couple did an addition or subtraction problem.  I made them peer edit their problems before putting them on good paper.  The front showed the problem, while the back showed their estimate and solution.  We had a blast!  They are really proud of their problems, and most included me eating cookies....I wonder where they got that idea? :)

Here are some fantastic examples of our work!


Saturday, December 15, 2012

Number Talks: Division


We've been doing a lot of division lately and I began to notice that the preferred method is the traditional algorithm, mainly because that’s what parents are more comfortable with at home when helping with homework.  Because of this, I was noticing that if students made a mistake in following the steps, they really didn't notice they were making a mistake, let alone that their answer was not reasonable.  So, I decided to encourage more mental math.  We did this through some number talks and the use of slates.  In previous Number Talks, I didn't allow my students to write anything down to force them to do work mentally, however, for the division number talks (at least at first) I allowed them to write down their thinking on slates so they wouldn't confuse themselves.  The only stipulation was that they weren't allowed to divide the “normal way.”  No “houses!”  

We started with smaller, simpler numbers: 25 ÷ 4.  Here is a picture of their thinking:


Molly began by saying, "I know that 4 x 5 = 20 , and that was too small, so I added another group of 4 to get to 24.  Then, I knew I just had to add one more to get to 25.  So I had 6 groups of 4 with one left over."


Once some students saw how others were using basic facts to help them, they began to catch on.  More and more students began volunteering their thinking.  This is something we will continue to build a knowledge base of.  My hope is that this will lead my students to a greater understanding of division and answers that are reasonable.

Blake is one of my students that has an amazing sense of numbers: he does almost all of his calculations mentally.  I always try to see what he is thinking to guide the other students.  

This was a great example of two students building from something they already knew: multiples of ten.  I love how one counted up from ten and the other counted down from 20!

Jillian wasn't afraid to say she started with a fact that was too low and built her way from there!  I always encourage them to admit when they make a mistake and tell us how they found it and fixed it!  Chances are, they aren't the only one making that mistake!

We are really improving and they are finally telling me how much they love math!
  

Monday, December 3, 2012

Division!

Oh the joys of division!  For whatever reason, my students are afraid, deathly afraid of division.  From their pre-assessments, I could tell they weren't really thinking of the actual numbers being divided, but more concerned with the PROCESS, and because of this were making silly, careless errors and their answers made no sense!  So, I decided to start at the basics: the concept of division and how it relates to multiplication.  We soon moved on to estimation and using compatible numbers (multiples of ten) to help us solve.  On Friday, we explored three different ways to divide.

We began by using base-ten blocks.  We are pretty good at using them after using them for modeling decimals as well as multiplication.  They knew that if they didn't have enough flats (100's) to fill in the groups evenly, they would have to break one into ten 10's and go from there.  I was extremely happy that they were so fluent in this from adding and subtracting decimals!  They had no idea they could divide this way.  I chose some of my struggling students to model this in front of the class.  They were extremely successful and were proud to show the class even they could divide large numbers.  Here are some pics of Sam and Bobby dividing using models:


Sam had to break a long into 10 ones! He did a great job!


 Next, we moved on to using the distributive property and expanded notation to divide.  The kids are pretty proficient in writing numbers in expanded notation, so we really just had to take it a step further to create the area model.  Here is Allison using her whiteboard to solve.  You can see she broke 248 into 200+40+8, then divided each part by two, and finally added her quotients.  Her area model is below, except I caught her before she had completed it, but you get the idea!


Below: Max bypassed drawing the model and opted instead to just divide each part by three.  Then, he added up the quotients.

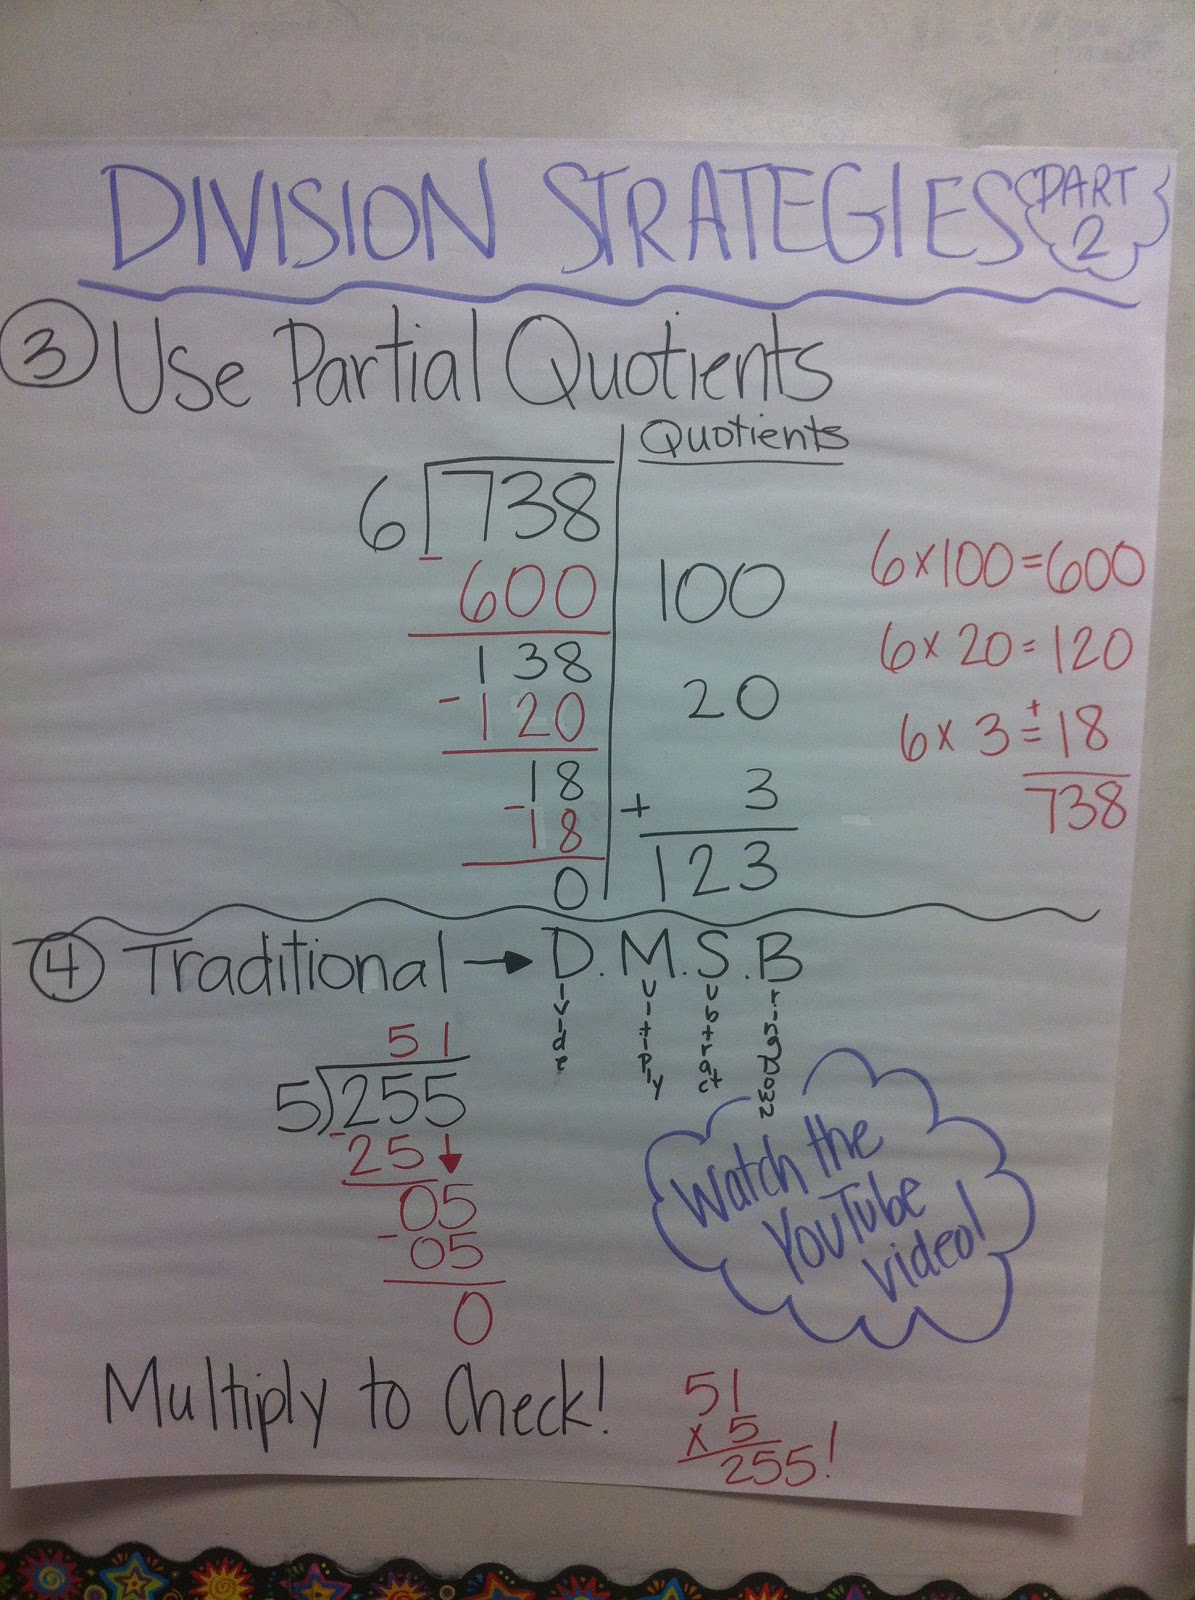
Lastly, we learned the partial quotients method for division.  Personally, this is my favorite.  It allows kids who aren't as proficient in their math facts to still be successful in division.  It also really shows the value of the numbers, something my students clearly struggle with.  Here is a shot of Keegan flying through a problem with ease.  I think he's found his favorite way to divide!


Today, after a long, warm weekend of fun, we spent some time going back over each method for division.  I split the kids up into partners: a student who "gets it" with a student who doesn't.  They really worked well together and as I circulated I heard the helpers saying things like "how many times does 3 go into 400-some?  Does it go in at least 10 times?  Do you think we can go higher?"  Sometimes, all it takes is some guidance from a peer rather than teacher lady.  I'm OK with that!

Lastly, we created anchor charts showing the ways for division.  We added a fourth way, the traditional way.  I found that my "high" kids like the traditional way, and I'll let them use it as long as they can explain each step using place value! (Muahahahaha!)  Don't forget to check out our division math rap on YouTube!


Common Core Connection: Standard: Find whole-number quotients of whole numbers with up to four-digit dividends and two-digit divisors, using strategies based on place value, the properties of operations, and/or the relationship between multiplication and division.  Illustrate and explain the calculation by using equations, rectangular arrays, and/or area models.

Mathematical Practices: Make sense of problems and persevere in solving them.